The other day I noticed TorturedCoach, a new face around the site this year, spitting out some tremendous stats in the Trade Talk thread and, long story short, we reached out to him and it turns out he’d compiled quite the data set and the analysis to boot on average differential and value. Without further adieu, TorturedCoach:
I should start with an introduction, I am a first year SC’er and as you can probably guess for the moniker I have chosen, it has been a tough introduction. I found this wonderful community after round 2, when for me the proverbial hit the fan and I went to the internet searching for answers.
As the year has progressed, I have spent my time building various databases to try to learn where the patterns are and to find what seems to be the key to SC, value. With this year almost done, all our eyes turn to next year and planning our teams for 22, so I thought I would begin by looking at the following:
- Difference in average between this year and the two previous seasons.
- The difference expressed as percentage growth. i.e. in 21 Walsh’s average has grown 19% compared to his final average for 20.
- The difference in their value now compared to their start price.
To try to keep everything in the context of starters for 22, I limited the groups to players valued $400k or above. The keepers and the ‘maybe I have to’ keepers, because everybody I pick gets injured and now, I have no trades… or was that just me.
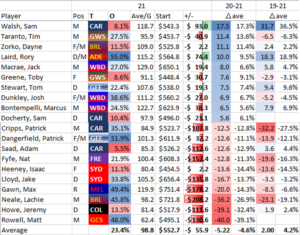
Popular (Starting Ownership >5%) (min 3 games in both seasons)
39 players
Rory Laird/Patrick Cripps
The Crows midfielder kept his defensive status, making him the top pick for the non-rookies, and justifiably so. As the numbers show he has increased his points output consistently over the last few seasons. The Blue boy may have looked like a pandemic blip with his scoring from last year but has dipped even further this year from his 19 levels.
Tim Taranto/Toby Greene/Jeremy Howe
The two giants have a similar story, both had a rough time last season, so have improved, but have yet to return to their pre-pandemic levels. Howe’s data shows he was a pandemic flash in the pan, and he returned to the 80ish average of 19.
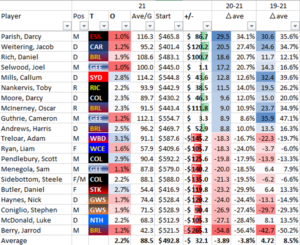
PODs (Starting Ownership 1-5%)
73 Players
Darcy Parish/Jacob Weitering
Parish has had a well publicised breakout season and the numbers how significant a jump he has made this season. Weitering has also shown a significant, if not as large, jump this season, which moves him close to the 100 average. With Mills and Laird likely Mids. only next season, could he be worth a gamble?
The Deceivers
Most the players in the bottom 10 here showed a significant uptick in 20 which led many a coach to be deceived into think it was a beginning rather than a pandemic aberration. Sometimes the risk doesn’t pay off.
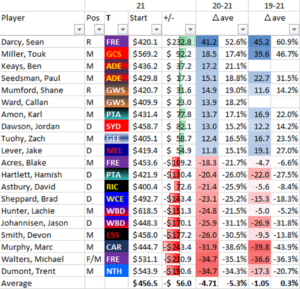
Hail Mary’s (Starting Ownership <1%) (min 9, 2021 games)
86 players
Sean Darcy/Touk Miller
These two offer a nice contrast in how we got to similar results, with one exploding this year and the other continuing a trend. The big docker has had a fantastic season, increasing his output by 50%, showing a great scoring ability. With many thinking of starting him next year, will this year be his aberration or the new normal?
Miller on the other hand, I had to recheck his starting ownership about 15 times…*checks again*… yep, 0.3%, how did that happen? He improved by 30% last year and back it up this year by adding another 15% on top.
Lachie Hunter
With that price tag, his drop off this season will have been painful. Of the 17 players priced over %600k, only Neale has had a worse season. But he has shown he has the potential to score well and will start next season around $450k. Is he worth a gamble or is the gravity of the other big dogs too strong for him to return to his past heights?
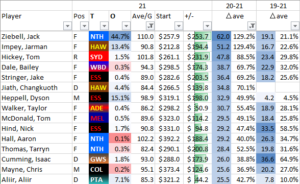
Bolters (Players below $400k averaging 80+)
These players are the gold dust if you can find one, and being new and naïve, all my runners stayed in the gate. What can we glean from the ones that did bolt from deep to become worthwhile? What we notice is most of these players had uncharacteristically bad years last year, which is shown by the larger numbers for 20. Also, we note, this year has been particularly good with none of the top 15 coming in under their 19 averages. So, they were underpriced and bound to bounce back, but there were plenty who didn’t of the under $400k group, with only 11% getting over 80 (37 of 335).
I hope you found this helpful. I am going to continue to look at the data and investigate other indicators of performance. If you feel like having a play with data, I have included full data set below:
Great work TorturedCoach! With all this info and data I think you’ll easily jump in the rankings next year
Great stuff! It’s always exciting to see new faces putting out content for the site.
One thing that might be worth looking into is adding player ages into the data – it wouldn’t explain players like Ziebell exploding in output due to a role change, but as most players follow a fairly typical path of growth and decline as they age, generally peaking from around 23 through 28 (25 through 30 for rucks and KPPs), it can be helpful to look at where players are at on that journey.
Even without that, though, there’s some great stuff there already, particularly with the ability to look at percentage change from both 20-21 and 19-21 at the same time.
Nice idea, could even group players by age group, might give a good idea of who might be the next up and comer. It really baffled me that SC didn’t have age as part of the player profile.
Great stuff. I’m suddenly remined of the legendary AllSaints.
Brilliant. I haven’t had a chance to look at the full data set yet, but I’ll be interested to see how the aggregate scoring comparison goes (as opposed to scoring averages). Hickey, for example has been great but has missed a couple of games which hurts his relevance.
I had a look at Hickey and calculated the average by rounds(ex bye) not games
Ave/G – 101.8 Ave/R – 91.6 – missed 2 games
Compared this to the other top rucks to miss games
Grundy
Ave/G – 118.4 Ave/R – 106.6 – missed 2
Darcy
Ave/G -119.4 Ave/R – 114.0 – missed 1
The other 3 haven’t missed a game
Gawn – 119.9
NicNat – 112.1
Goldy – 102.4
My giddy aunt this is good stuff! Magnificent, TorturedCoach!!
Well done TorturedCoach. Excellant.
Thanks, for providing this to the SCT community.
Cheers.
Thanks torturedcoach. This is terrific!
Great work!